All categories
Featured selections
Trade Assurance
Buyer Central
Help Center
Get the app
Become a supplier
Công cụ cắt Excel
(Có 95 sản phẩm)
2025-11-28
Alibaba
Nhà cửa & Vườn tược
Đồ dùng nhà bếp
Dụng cụ và đồ dùng nhà bếp
Dụng cụ chế biến rau củ và trái cây
Previous slide
Next slide
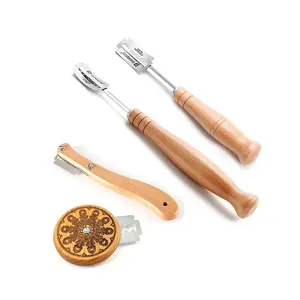
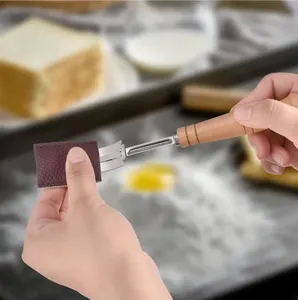
Dao cắt bánh bằng thép không gỉ thân thiện với môi trường, có thể điều chỉnh độ cao lát, kèm cán nhựa
$5.98-6.99
Đơn hàng tối thiểu: 20 pieces
Previous slide
Next slide
Dao Cắt Lát Bánh Mì Với 10 Lưỡi Dao Cắt Bột Dao Cắt Điểm Bánh Mì Dao Chấm Điểm Dao Làm Bột Bánh Mì Nấu Ăn
Sẵn sàng vận chuyển
21.700-36.618 ₫
Đơn hàng tối thiểu: 200 Cái
Previous slide
Next slide
Hướng dẫn sử dụng Rau Trái Cây công cụ dưa chuột cắt
Slicer
tiện ích nhà bếp lưỡi thép không gỉ cà rốt Splitter
Slicer
Divider Splitter
Sẵn sàng vận chuyển
23.598-26.853 ₫
Đơn hàng tối thiểu: 120 Cái
Previous slide
Next slide
Nhà bếp gadgtes salad công cụ đa chức năng nhựa hành tây tỏi rau vắt tay cắt trái cây thực phẩm
Slicer
Dicer
58.046-94.120 ₫
Đơn hàng tối thiểu: 1 Bộ
Previous slide
Next slide
Hướng dẫn sử dụng thép không gỉ APPLE corer
Slicer
Cutter 8 lưỡi cắt trái cây sắc nét Apple
Slicer
corer trái cây Peeler Divider
17.089-19.258 ₫
Đơn hàng tối thiểu: 3 Cái
Previous slide
Next slide
Nhà Máy Chất Lượng Tuyệt Vời 3in1 Nhà Bếp Rau Peeler Khoai Tây Cà Rốt Peeler Lột Dao Dài Xử Lý Trái Cây Lột Công Cụ
13.562-16.275 ₫
Đơn hàng tối thiểu: 100 Cái
Previous slide
Next slide
Hiệu suất cao đẩy Rau slicers thép không gỉ hành tây cắt trái cây công cụ được sản xuất bởi các nhà sản xuất tuyệt vời
Sẵn sàng vận chuyển
32.549-42.314 ₫
Đơn hàng tối thiểu: 3 Cái
Previous slide
Next slide
Đa Chức Năng Dụng Cụ Nhà Bếp Của Nhãn Hiệu Cấp Thực Phẩm Hướng Dẫn Sử Dụng
Slicer
Scrubber Vắt Tay Cho Các Loại Trái Cây Rau Hành Tây Chopper Cutter Set
70.251-86.526 ₫
Đơn hàng tối thiểu: 10 Cái
1
2
3
Các danh mục hàng đầu
Phụ kiện hút thuốc & Bật lửa
Trang trí nội thất
Nhà Hàng Dệt May
Vật tư trang trí tiệc & lễ hội
Thiết bị cải tạo nhà thông minh
Đồ uống & phụ kiện
Đồ dùng cất trữ & sắp xếp đồ đạc gia đình
Vật dụng làm vườn
Dụng cụ & đồ dọn nhà
Bộ đồ ăn 、 cà phê và rượu vang
Đồ dùng nhà bếp
Đồ dùng gia đình
Previous slide
Next slide
Các tìm kiếm liên quan:
công cụ cắt dưa hấu và táo
dao đa chức năng bằng nhựa
công cụ cắt máy cắt
máy cắt đa chức năng
máy thái lát tay phô mai
các công cụ cắt
công cụ cắt dưa hấu
công cụ cắt máy cắt thực phẩm trong bếp
dao cắt lát gọt vỏ
bộ multi slicer
công cụ cắt
máy cắt bằng tay
dao cắt rau củ bằng tay
hướng dẫn cắt bằng tay
công cụ cắt máy cắt thực phẩm


 Sẵn sàng vận chuyển